
Interest in rental properties continues to grow
The boost that the federal home buyer tax credit gave the Houston housing market in April 2010 continues to overshadow local home sales one year later. Sales of homes declined in April 2011 along with average and median prices, however volume rose among rental properties.
According to the latest monthly data compiled by the Houston Association of REALTORS® (HAR), April single-family home sales fell 14.2 percent versus one year earlier. Only the under-$80,000 segment of the market experienced increased sales, which weighed down pricing. Compared to April of 2009, a year with no unusual market factors such as Hurricane Ike in 2008 and the 2010 tax credit, single-family home sales were up 10.1 percent.
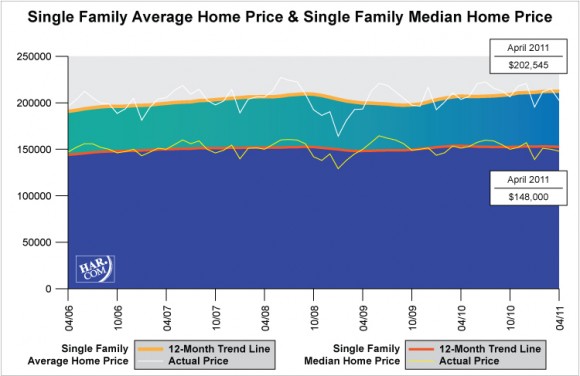
The average price of a single-family home dipped 0.6 percent from April 2010 to $202,545. The April single-family home median price—the figure at which half of the homes sold for more and half sold for less—declined 2.2 percent year-over-year to $148,000.
Foreclosure property sales reported in the Multiple Listing Service (MLS) decreased 4.6 percent in April compared to one year earlier. Foreclosures comprised 22.0 percent of all property sales in April, down from 23.5 percent in March. The median price of April foreclosures fell 10.4 percent to $79,700 on a year-over-year basis.
April sales of all property types in Houston totaled 5,534, down 12.0 percent compared to April 2010. Total dollar volume for properties sold during the month declined 12.8 percent to $1.1 billion versus $1.2 billion one year earlier.
“The April home sales figures remain skewed, as this was the period last year when the final push was on for consumers to beat the April 30 home buyer tax credit deadline,” said Carlos P. Bujosa, HAR chairman and VP at Transwestern. “We see tremendous interest in the Houston housing market as local employment numbers strengthen, particularly among rental properties, which give consumers an option until they are ready to enter the market as buyers.”
April Monthly Market Comparison
The month of April brought Houston’s overall housing market largely negative results when all listing categories are compared to April of 2010. Total property sales, total dollar volume and both average and median prices declined on a year-over-year basis.
| CATEGORIES | APRIL 2010 | APRIL 2011 | PERCENT CHANGE |
|---|---|---|---|
| Total property sales | 6,288 | 5,534 | -12.0% |
| Total dollar volume | $1,236,932,669 | $1,078,640,018 | -12.8% |
| Total active listings | 48,869 | 51,694 | 5.8% |
| Total pending sales | 4,613 | 3,745 | -18.8% |
| Single-family home sales | 5,391 | 4,625 | -14.2% |
| Single-family average sales price | $203,737 | $202,545 | -0.6% |
| Single-family median sales price | $151,260 | $148,000 | -2.2% |
| Months inventory* | 6.5 | 7.8 | 20.6% |
| *Months inventory estimates the number of months it will take to deplete current active inventory based on the prior 12 months sales activity. This figure is representative of the single-family homes market. | |||
Month-end pending sales for April totaled 3,745, down 18.8 percent from last year. That suggests the likelihood of lower demand when the May figures are totaled. The number of available properties, or active listings, at the end of April rose 5.8 percent from April 2010 to 51,694. The increase in available housing pushed the April inventory of single-family homes to 7.8 months compared to 6.5 months one year earlier. That means that it would take 7.8 months to sell all the single-family homes on the market based on sales activity over the past year. The figure still compares favorably to the national inventory of single-family homes of 8.4 months reported by the National Association of REALTORS® (NAR).
Single-Family Homes Update
April sales of single-family homes in Houston totaled 4,625, down 14.2 percent from April 2010. This follows 5.3 percent and 2.2 percent declines in March and February respectively, and an 8.3 percent jump in January, which marked the first increase in seven months. When compared to April of 2009, a year in which there were no unusual real estate market influences such as Hurricane Ike in 2008 and the home buyer tax credit in 2010, single-family home sales were up 10.1 percent.

Broken out by segment, April sales of homes priced below $80,000 climbed 27.6 percent; sales of homes in the $80,000-$150,000 range dropped 21.8 percent; sales of homes between $150,000 and $250,000 declined 23.5 percent; sales of homes ranging from $250,000-$500,000 slid 13.1 percent; and sales of homes that make up the luxury market—priced from $500,000 and up—were down 3.0 percent.

Strong sales volume in the under-$80,000 home segment weighed down pricing. At $202,545, the average price of single-family homes dipped 0.6 percent compared to one year earlier. At $148,000, the median sales price for single-family homes declined 2.2 percent versus April 2010. The national single-family median price reported by NAR is $160,500, illustrating the continued higher value and lower cost of living available to consumers in Houston.
HAR also breaks out the sales performance of existing single-family homes throughout the Houston market. In April 2011, existing home sales totaled 3,963, a 11.6 percent drop from April 2010. The average sales price ticked up 0.6 percent to $191,807 compared to last year and the median sales price of $138,000 fell 2.8 percent.
Townhouse/Condominium Update
The number of townhouses and condominiums that sold in April dropped 15.2 percent compared to one year earlier. In the greater Houston area, 419 units were sold last month versus 494 properties in April 2010.

The average price rose 3.3 percent to $168,132 from April 2010 to April 2011. The median price of a townhouse/condominium declined 4.2 percent to $130,000.
Lease Property Update
Demand for single-family home rentals continued to soar in April, rising 27.9 percent compared to one year earlier. Year-over-year townhouse/condominium rentals increased 27.1 percent.
Houston Real Estate Milestones in April
- When compared to April 2009, a year with no unusual market factors such as Hurricane Ike in 2008 and the 2010 tax credit, single-family home sales were up 10.1 percent;
- Single-family home rentals rose 27.9 percent;
- Townhouse/condominium rentals increased 27.1 percent;
- 7.8 months inventory of single-family homes compares favorably to the national average of 8.4 months.