

Fusion Stats Pro Quick Start Guide
What is Fusion Stats Pro?
- Fusion Stats Pro is an application that creates statistical charts and reports based on search criteria entered or a set of selected listings. Analysis is not limited to 250 or 500 results.
- Stats Pro enables the grouping and filtering of the statistical data that appears on the charts and reports.
- These charts and reports can also be printed or saved as a PDF.
- Available Tuesday, October 15.
How does it Work?
There are two primary ways to access Fusion Stats Pro:
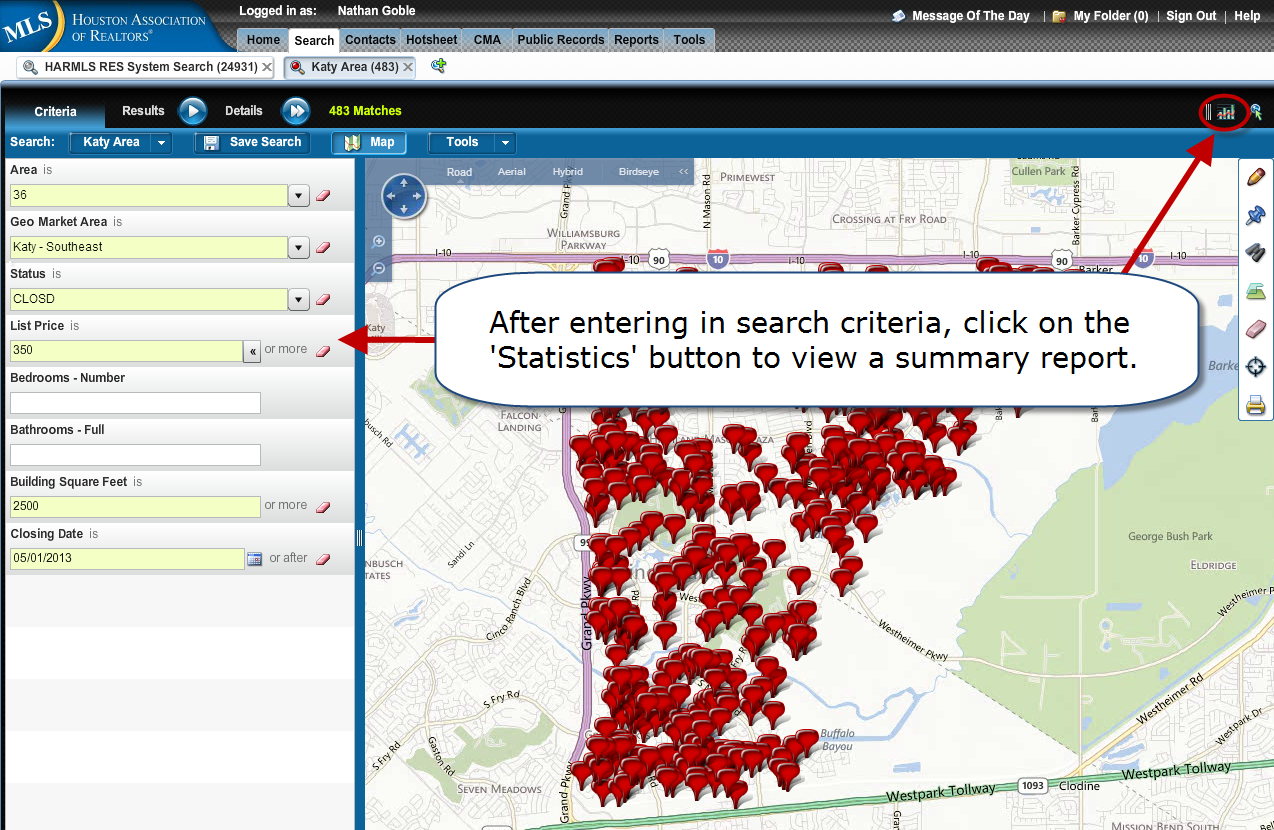
Access Fusion Stats Pro From the Criteria Page
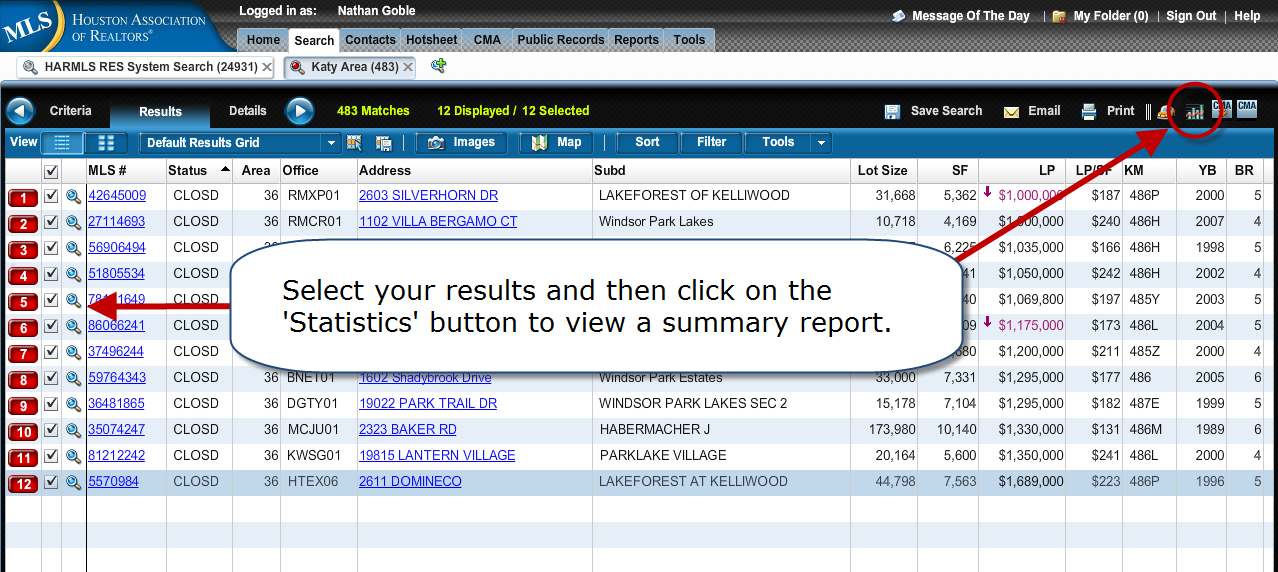
Access Fusion Stats Pro From the Results Page
OK, so what will it show me?
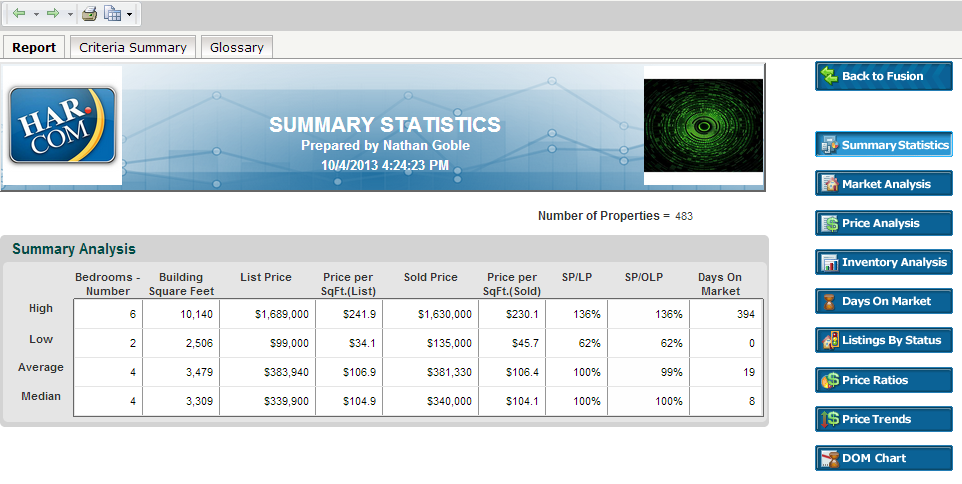
A summary statistics page will load and analyze the data based on how it is being accessed. This report will give provide the High, Low, Average and Median values for the following fields:
- Bedrooms
- Building Square Feet (SqFt)
- List Price
- Price Per SqFt.(List)
- Sold Price
- Price Per SqFt.(Sold)
- Sales Price/List Price (SP/LP)
- Sales Price/Original List Price (SP/OLP)
- Days on Market
Sample Summary Statistics Report:
Nice. Is there anything else I should know?
Yes. In addition to the summary statistics, Stats Pro also has a set of reports that can be accessed to the right of the Summary Statistics:
Market Analysis Dashboard
- Summary Statistics along with Market Trends and Percentage Growth graphs.
- Market Trends Graph displays the average and median values for each attribute in the drop-down box above the graph over time.
- Percentage Growth Graph displays a comparison of change from the current period to a period in the past for each attribute in the drop-down box above the graph. Values above the zero line represent positive growth (blue) and values below the zero line (orange) represent a negative change.
- Graphs can be configured for different attributes as well as time.
Price Analysis Dashboard
- Identifies the count of listings, average Days On Market (DOM) and number of properties by bedroom count for each price range.
Inventory Analysis Dashboard
- Identifies the count of listings, price activity and average DOM by each status along with Inventory Trends and Percentage Growth graphs.
- Inventory Trend Graph displays the count for each attribute in the drop-down box above the graph over time.
- Percentage Growth Graph displays a comparison of change from the current period to a period in the past for each attribute in the drop-down box above the graph. Values above the zero line represent positive growth (blue) and values below the zero line (orange) represent a negative change.
- Graphs can be configured for different attributes as well as time.
- Multiple statuses suggested for best use of this feature.
Days on Market Dashboard
- Identifies the count of listings, Avg SP/LP ratio and Avg Sp/OLP ratio within each DOM range. The dashboard also includes DOM Trends and Percentage Growth graphs.
- DOM Trends Line Graph displays the average SP/LP and SP/OLP over time.
- Percentage Growth Graph displays a comparison of change from the current period to a period in the past for either SP/LP or SP/OLP. Values above the zero line represent positive growth (blue) and values below the zero line (orange) represent a negative change.
- Graphs can be configured for different variables as well as time.
- This feature is to only be used with sold listings.
Listings by Status Chart
- Pie chart displays a breakdown of listings by each status type.
- Multiple statuses suggested for best use of this feature.
Price Ratios
- Displays the SP/LP and SP/OLP of listings by DOM ranges.
- This feature is to only be used with sold listings.
Price Trends Chart
- Displays the average sales price or number of properties closed over time.
- This feature is to only be used with sold listings.
Days on Market Chart
- The bar graph displays a comparison of high, low, average and median values for Days on Market. The pie chart displays the number of listings within each DOM range for sold listings.
- This chart is to only be used with sold listings.