

Home sales and inventory show overall stability
The road back to market “normalcy,” still lined with mortgage rate volatility, led to an April that showed signs of market resiliency, but remained down when compared to April 2022. April became the 13th straight month in which sales volume trailed the previous year and the third consecutive month in which prices failed to top the previous year’s levels.
According to the Houston Association of REALTORS®’ (HAR) April 2023 Market Update, single-family home sales remained down 18.4 percent year-over-year with 7,310 units sold compared to 8,955 in April 2022. However, when compared to April 2019, when sales volume totaled 7,673 units, sales were down just 4.7 percent. In addition, inventory remains steady and well above the historic lows of 2022, providing more housing options for buyers as we enter the traditionally prime sales season.
All housing segments experienced declines in April when compared to 2022. Single-family rentals benefited again from strong consumer demand as many would-be homebuyers are still turning to the rental market amid ongoing uncertainty about interest rates and inflation. HAR will publish its April 2023 Rental Home Update next Wednesday, May 17.
“The housing market turnaround was never going to happen overnight, especially with interest rates still fluctuating, uncertainty about inflation and speculation about a recession,” said HAR Chair Cathy Treviño with Side, Inc. “Anecdotally, we have many REALTORS® reporting that their sub-markets are performing well, which underscores the fact that real estate is local. We are still hopeful that the Houston housing market as a whole will strengthen later this year.”
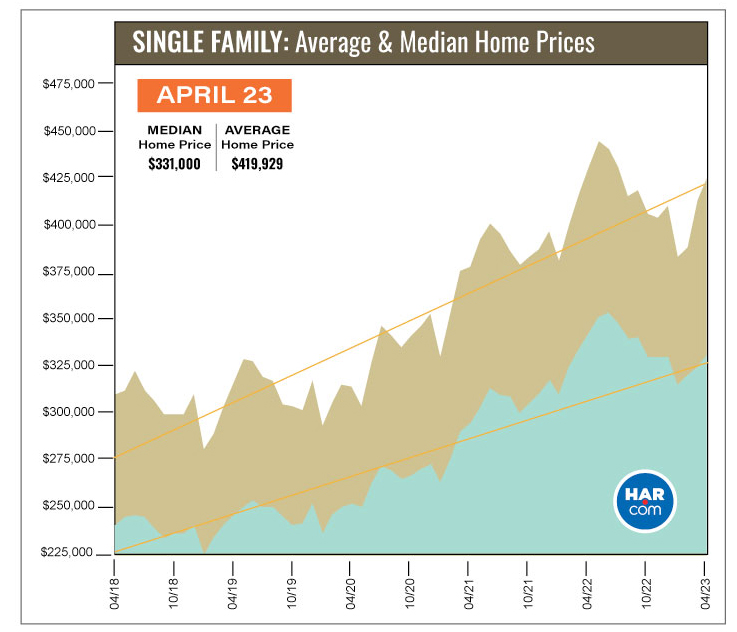
Single-family home prices fell for only the third time since the spring of 2020. The average price dipped 1.3 percent to $419,929 while the median price fell 3.6 percent to $331,000. That is in sharp contrast to the record high prices of $438,327 (average) in May 2022 and $353,995 (median) in June 2022.
April Monthly Market Comparison
April marked the 13th straight month of negative sales as housing throughout the Houston market and across the U.S. suffers the lingering effects of economic uncertainty with mortgage interest rates still in flux. Year-over-year single-family home sales were down 18.4 percent, but when compared to April 2019, before the pandemic, sales were down just 4.7 percent, and stacked against April 2018, five years ago, sales were up 3.9 percent.
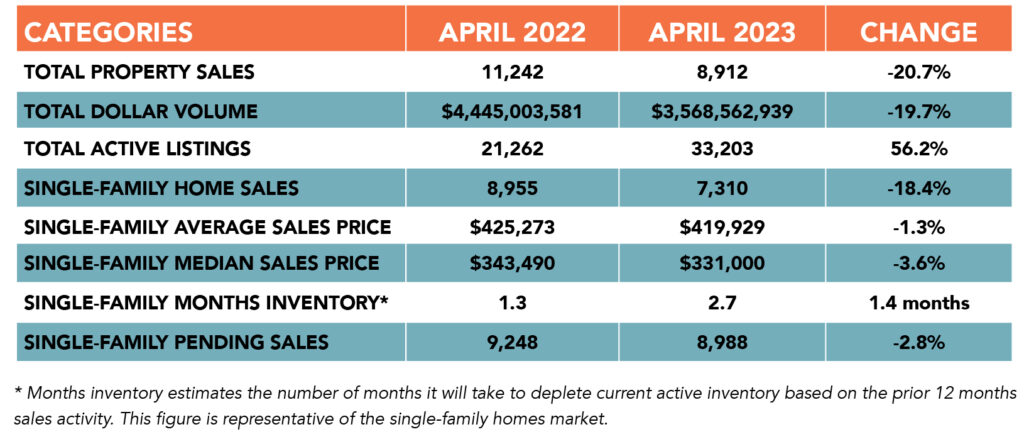
In addition to the drop in single-family home sales, total property sales and total dollar volume also fell short of last year’s levels. Single-family pending sales dropped 2.8 percent. Active listings, or the total number of available properties, was 56.2 percent ahead of their 2022 level.
Months of inventory continued to improve in April, growing to a 2.7-months supply. Housing inventory nationally stands at a 2.6-months supply, according to the latest report from the National Association of REALTORS® (NAR). A 4.0- to 6.0-months supply is commonly regarded as a “balanced market” in which neither the buyer nor the seller has an advantage.
April Single-Family Homes Update
Single-family home sales fell 18.4 percent year-over-year in April with 7,310 units sold across the Greater Houston area compared to 8,955 in 2022. Pricing continues to ease after soaring to record highs last spring. The April average price fell 1.3 percent to $419,929 while the median price declined 3.6 percent to $331,000. February 2023 marked the first pricing declines the Houston housing market had experienced in more than two years.
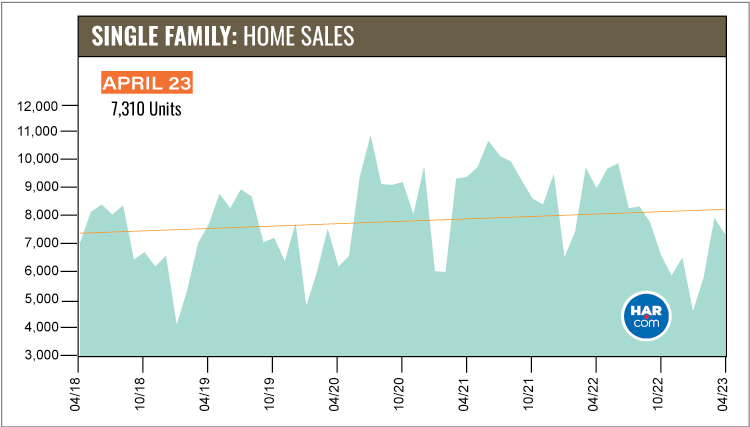
For a pre-pandemic perspective, April sales were down 4.7 percent compared to April 2019, when a total of 7,673 single-family homes sold. The April 2023 median price of $331,000 is 35.1 percent higher than it was in 2019 ($245,000) and today’s average price of $419,929 is 35.2 percent higher than it was then ($310,432). Sales are 3.9 percent ahead of where they were five years ago, in April 2018, when volume totaled 7,035. Back then, the median price was $240,000 and the average price was $304,890.
Days on Market, or the actual time it took to sell a home, increased from 34 to 55 days. Months of inventory registered 2.7 months compared to 1.3 months a year earlier. The current national supply stands at 2.6 months, as reported by NAR.
Broken out by housing segment, April sales performed as follows:
- $1 – $99,999: decreased 36.4 percent
- $100,000 – $149,999: decreased 30.3 percent
- $150,000 – $249,999: decreased 12.2 percent
- $250,000 – $499,999: decreased 19.7 percent
- $500,000 – $999,999: decreased 22.0 percent
- $1M and above: decreased 22.4 percent
HAR also breaks out sales figures for existing single-family homes. Existing home sales totaled 5,391 in April, down 24.5 percent from the same month last year. The average price fell 3.0 percent to $415,699 and the median sales price declined 4.8 percent to $320,000.
For HAR’s Monthly Activity Snapshot (MAS) of the April 2023 trends, please click HERE to access a downloadable PDF file.
Townhouse/Condominium Update
Townhouses and condominiums experienced their 11th consecutive monthly decline in April, dropping 33.2 percent year-over-year with 544 closed sales versus 814 a year earlier. The average price rose 1.7 percent to $279,257 and the median price was statistically flat at $234,000. Both figures are below the historic highs reached in April 2022. Inventory grew from a 1.3-months supply to 2.4 months.
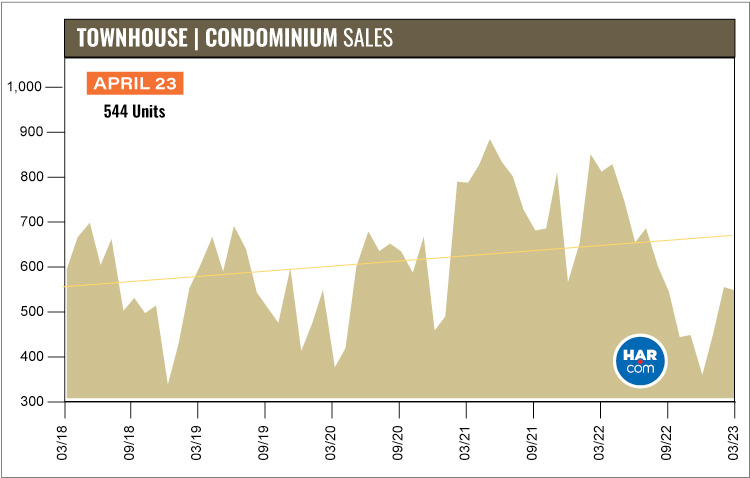
Compared to pre-pandemic April 2019, when 602 units sold, townhome and condominium sales were down 9.6 percent. The average price back then, at $203,335, was 37.3 percent lower and the median price, at $162,000 was 44.4 percent lower.
Houston Real Estate Highlights in April
- Single-family home sales were down 18.4 percent year-over-year, as prospective homebuyers pull back their purchase plans amid mortgage rate fluctuations;
- Compared to pre-pandemic 2019, single-family home sales were down 4.7 percent, however they were up 3.9 percent versus the volume five years ago, in April 2018;
- All housing segments experienced sales declines;
- Days on Market (DOM) for single-family homes rose from 34 to 55 days;
- Total property sales fell 20.7 percent with 8,912 units sold;
- Total dollar volume dropped 19.7 percent to $3.6 billion;
- The single-family median price dropped 3.6 percent to $331,000;
- The single-family average price fell 1.3 percent to $419,929;
- Single-family home months of inventory registered a 2.7-months supply, up from 1.3 months a year earlier;
- Townhome/condominium sales experienced their 11th straight monthly decline, falling 33.2 percent, with the median price flat at $234,000 and the average price up 1.7 percent to $279,257;
- Compared to pre-pandemic 2019, townhome and condominium sales were down 9.6 percent.