

“Market endures another round of sales and pricing declines on the road back to “normalcy.”
With March home sales figures in the books, the Houston Association of Realtors® (HAR) continues to conduct a two-tiered analysis of Houston real estate in an effort to provide the most accurate assessment of market conditions: a comparison to 2019 – the last “normal” year before the pandemic, as well as 2022. March marked the 12th consecutive month of falling sales and the second straight month of slightly lower prices.
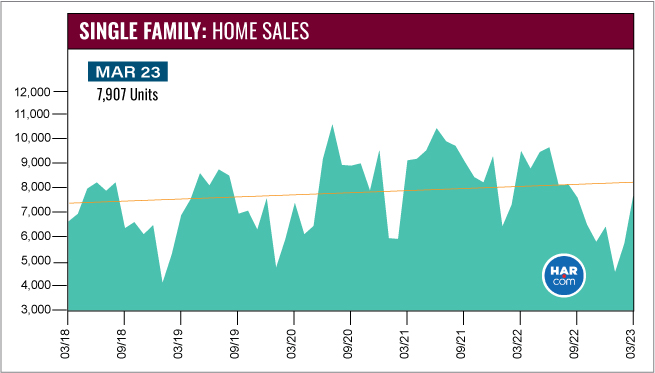
According to the HAR March 2023 Market Update, single-family home sales fell 18.3 percent year-over-year, with 7,907 units sold compared to 9,681 in March 2022. However, when compared to March of 2019, when sales volume totaled 6,995 units – sales were up 13.0 percent.
All but the sub-$100,000 housing segment saw year-over-year declines in March. Single-family rentals scored solid gains once again, as many buyers continued turning to the rental market amid lingering uncertainty about interest rates and inflation. HAR will issue its March 2023 Rental Home Update next Wednesday, April 19.
“Houston real estate is continuing to work its way back to normalcy with more new listings hitting the market and prices easing,” said HAR Chair Cathy Treviño with Side, Inc. “Inflation and interest rates are still causing angst, but once consumer confidence is finally restored, we will see home sales pick up and probably return to the seasonal cycles that prevailed before the pandemic.”
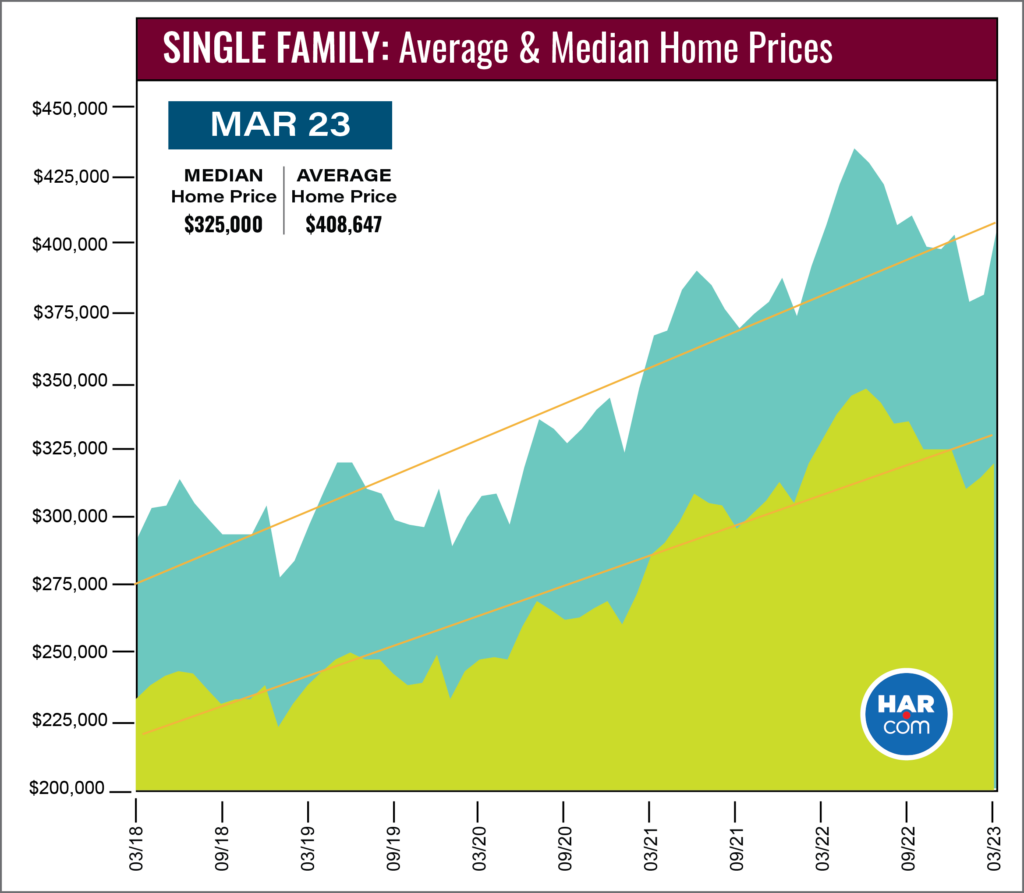
Single family home prices fell for only the second time since the spring of 2020. The median price dropped 3.0 percent to $325,000 while the average price was statistically flat at $408,647. That is in sharp contrast to the all-time pricing highs of $438,313 (average) in May 2022 and $353,995 (median) in June 2022.
March Monthly Market Comparison
March became the 12th consecutive month of negative sales as housing throughout the Houston market and across the U.S. recovers from inflationary headwinds. Year-over-year single-family home sales fell 18.3 percent, but when compared to March 2019, before the pandemic, sales were up 13.0 percent, and stacked against March 2018, five years ago, sales were up 17.3 percent.
Most of the March housing measurements consisted of negative numbers. In addition to the drop in single-family home sales, total property sales and total dollar volume fell. Single-family pending sales dropped 5.2 percent. Active listings (the total number of available properties) remained 69.2 percent ahead of their level of one year ago.
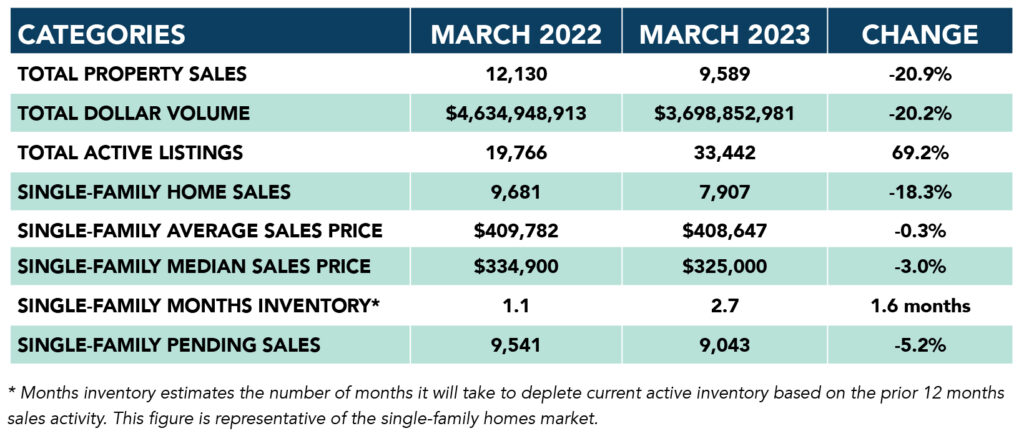
Months of inventory continued to improve in March, growing to a 2.7-months supply. Housing inventory nationally stands at a 2.6-months supply, according to the latest report from the National Association of REALTORS® (NAR). A 4.0- to 6.0-months supply is widely regarded as a “balanced market” in which neither the buyer nor the seller has an advantage.
Single-Family Homes Update
Single-family home sales fell 18.3 percent year-over-year in March, with 7,907 units sold across the Greater Houston area compared to 9,681 in 2022. Pricing continues to moderate after reaching record highs last spring. The March median price fell 3.0 percent to $325,000 while the average price was statistically flat at $408,647. February 2023 marked the first pricing declines the market had seen in more than two years.
For a pre-pandemic perspective, March sales are up 13.0 percent compared to March 2019, when a total of 6,995 single-family homes sold. The median price back then was 26.2 percent lower at $240,000, and the average price, at $298,356, was 27.0 percent lower. Sales are 17.3 percent ahead of where they were five years ago, in March 2018, when volume totaled 6,740. Back then, the median price was 27.7 percent lower at $235,400 and the average price was 28.3 percent lower at $292,966.
Days on Market, or the actual time it took to sell a home, increased from 38 to 62 days. Months supply registered 2.7 months compared to 1.1 months a year earlier. The current national supply stands at 2.6 months, as reported by NAR.
Broken out by housing segment, March sales performed as follows:
- $1 – $99,999: increased 28.7 percent
- $100,000 – $149,999: decreased 14.2 percent
- $150,000 – $249,999: decreased 20.3 percent
- $250,000 – $499,999: decreased 18.7 percent
- $500,000 – $999,999: decreased 18.3 percent
- $1M and above: decreased 20.4 percent
HAR also breaks out sales figures for existing single-family homes. Existing home sales totaled 5,613 in March, down 24.5 percent from the same month last year. The average price fell 1.2 percent to $404,159 and the median sales price declined 2.8 percent to $315,000.
For HAR’s Monthly Activity Snapshot (MAS) of the March 2023 trends, please click HERE to access a downloadable PDF file.
Townhouse/Condominium Update
Townhouses and condominiums experienced their 10th consecutive monthly decline in March, down 35.3 percent year-over-year with 553 closed sales versus 855 a year earlier. The average price rose 6.0 percent to $270,294 – ending four straight months of declines – and the median price rose 4.0 percent to $223,500 – ending three months of declines. Both figures are below the historic highs reached in April 2022. Inventory grew from a 1.3-months supply to 2.2 months.
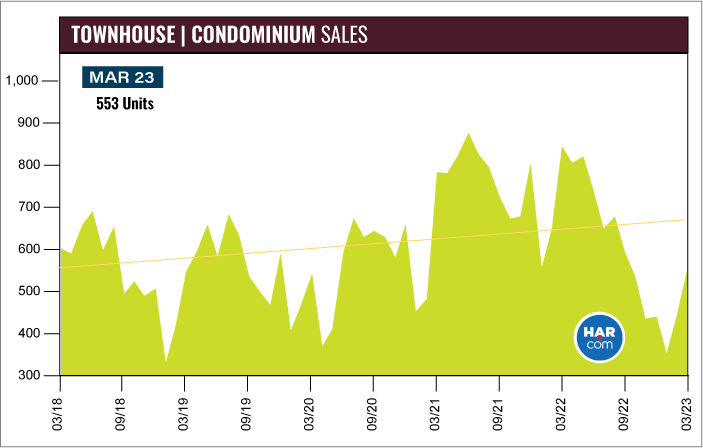
Compared to pre-pandemic March 2019, when 550 units sold, townhome and condominium sales were statistically unchanged. The average price back then, at $211,430, was 21.8 percent lower and the median price, at $175,000 was 21.7 percent lower.
Houston Real Estate Highlights in March
- Single-family home sales fell 18.3 percent year-over-year, as the market continues its gradual return to normalcy;
- Compared to pre-pandemic 2019, single-family home sales rose 13.0 percent;
- All but the sub-$100,000 housing segment experienced negative sales;
- Days on Market (DOM) for single-family homes rose from 38 to 62 days;
- Total property sales fell 20.9 percent with 9,589 units sold;
- Total dollar volume dropped 20.2 percent to $3.7 billion;
- The single-family median price dropped 3.0 percent to $325,000;
- The single-family average price was statistically flat at $408,647;
- Single-family home months of inventory registered a 2.7-months supply, up from 1.1 months a year earlier;
- Townhome/condominium sales experienced their 10th straight monthly decline, falling 35.3 percent, with the median price up 4.0 percent to $223,500 and the average price up 6.0 percent to $270,294;
- Compared to pre-pandemic 2019, townhome and condominium sales were unchanged.

