

Sales decline by the smallest amount in more than a year, prices stabilize and inventory grows
Even with some indicators in negative territory, the Houston housing market continues to demonstrate that it is returning to a more normal state as it moves beyond the pandemic and the challenges posed by rising interest rates. Home sales across Greater Houston were down for a 16th straight month in July, but the rate of decline was the smallest in more than a year.
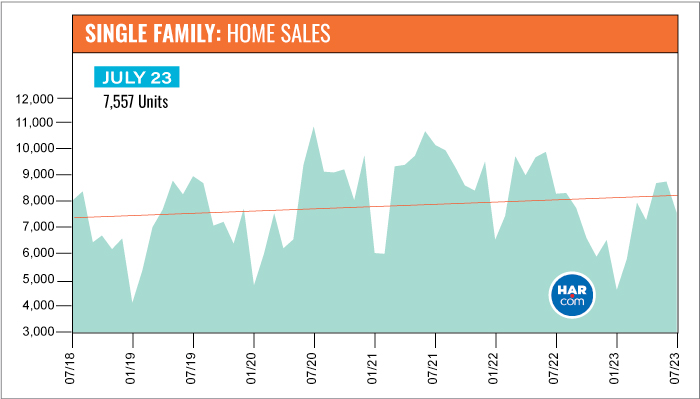
According to the Houston Association of Realtors’ (HAR) July 2023 Market Update, single-family home sales fell 8.5 percent year-over-year with 7,557 units sold compared to 8,256 in July 2022. That is the lowest decline since sales dropped 7.6 percent in June 2022. Months supply of homes climbed to 3.2, the highest level since May 2020 when it was 3.3. When compared to pre-pandemic July 2019, however, home sales were down 15.3 percent.
The sub-$100,000 housing segment, which represents just 1.2 percent of all homes on the market, was the only segment to experience a gain. Rentals of single-family homes and townhomes/condominiums continue to be strong. HAR will publish its July 2023 Rental Home Update next Wednesday, August 16.
“Each passing month has moved the Houston housing market closer to what we consider normal, with seasonal influences, but consumers are still understandably taking a cautious approach to the homebuying process, and many are ultimately choosing to rent,” said HAR Chair Cathy Treviño with LPT, Realty.
Single-family home prices continue to stabilize. The average price edged up just 0.6 percent to $428,140 while the median price fell 2.3 percent to $340,000. That keeps pricing below the record highs of $438,350 (average) in May 2022 and $354,000 (median) in June 2022.
July Monthly Market Comparison
July was the 16th straight month of negative sales as Houston. Year-over-year single-family home sales fell 8.5 percent, but when compared to July 2019, before the pandemic, sales were down 15.3 percent, and compared to July 2018, five years back, they were down 5.8 percent. The 8.5 percent decline is the smallest since the market registered a 7.6 percent drop in June 2022.
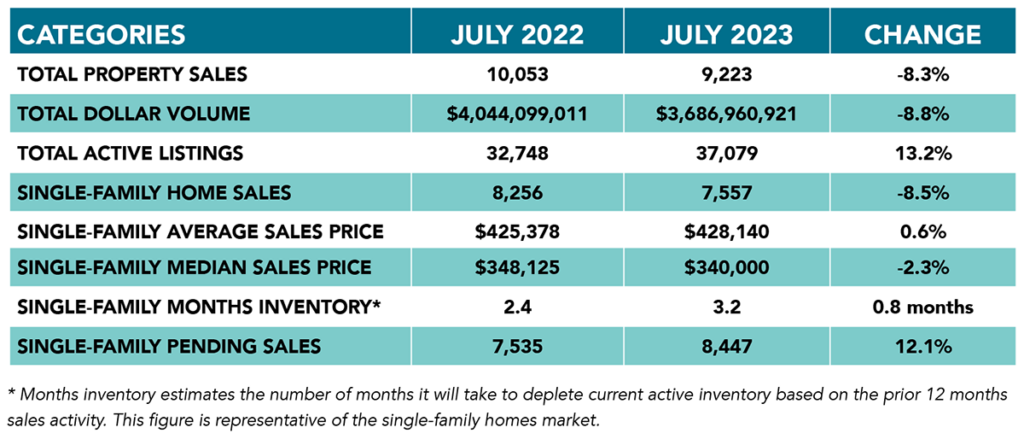
In addition to the decline in single-family sales volume, total property sales and total dollar volume also fell below last year’s levels. Total dollar volume was $3.7 billion, down from $4.0 billion a year earlier. Single-family pending sales rose 12.1 percent. Active listings, or the total number of available properties, were 13.2 percent ahead of the 2022 level.
Months of inventory increased in July, expanding to a 3.2-months supply. That is the greatest months supply since May 2020 when it was 3.3 months. Housing inventory nationally sits at a 3.1-months supply, according to the latest report from the National Association of Realtors (NAR). A 4.0- to 6.0-months supply has traditionally been considered a “balanced market” in which neither buyer nor seller has the advantage.
Single-Family Homes Update
Single-family home sales fell 8.5 percent year-over-year in July with 7,557 units sold across the Greater Houston area compared to 8,256 in 2022. Pricing continues to stabilize after soaring to record highs last spring. The July average price rose just 0.6 percent to $428,140 while the median price dropped 2.3 percent to $340,000.
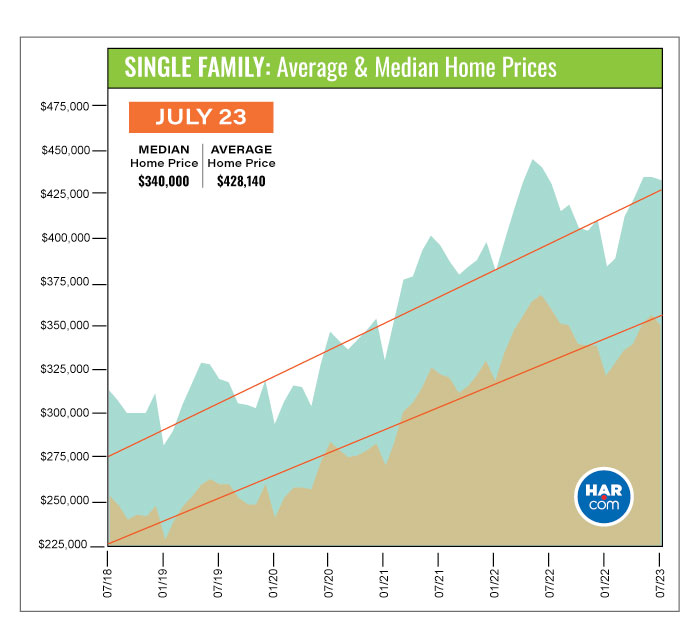
For a pre-pandemic perspective, July closings were 15.3 percent below July 2019’s total of 8,921. The July 2023 median price of $340,000 is 36.0 percent higher than it was in 2019 ($250,000) and today’s average price of $428,140 is 37.3 percent higher than it was then ($311,895). Sales are 5.7 percent below where they were five years ago, in July 2018, when volume totaled 8,019. Back then, the median price was $244,560 and the average price was $305,925.
Days on Market, or the actual time it took to sell a home, increased from 27 to 42 days. Months of inventory registered a 3.2-months supply compared to 2.4 months a year earlier. The current national supply stands at 3.1 months, as reported by NAR.
Broken out by housing segment, July sales performed as follows:
- $1 – $99,999: increased 6.5 percent
- $100,000 – $149,999: decreased 7.2 percent
- $150,000 – $249,999: decreased 6.1 percent
- $250,000 – $499,999: decreased 11.8 percent
- $500,000 – $999,999: decreased 8.3 percent
- $1M and above: decreased 2.6 percent
HAR also breaks out sales figures for existing single-family homes. Existing home sales totaled 5,860 in July, down 13.1 percent from the same month last year. The average price was statistically flat at $425,628 and the median sales price declined 1.1 percent to $336,150.
For HAR’s Monthly Activity Snapshot (MAS) of the July 2023 trends, please click HERE to access a downloadable PDF file.
Townhouse/Condominium Update
Townhouses and condominiums experienced their 14th consecutive monthly decline in July, falling 9.8 percent year-over-year with 590 closed sales versus 654 a year earlier. The average price rose 2.1 percent to $263,876 and the median price dropped 2.2 percent to $220,000. Inventory grew from a 1.9-months supply to 2.9 months, the highest level since February 2021.
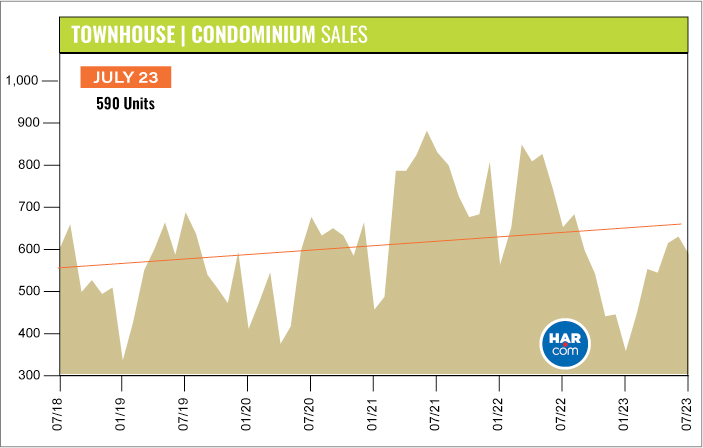
Compared to pre-pandemic July 2019, when 691 units sold, townhome and condominium sales were down 14.6 percent. The average price back then, at $203,142, was 23.0 percent lower and the median price, at $163,000 was 25.9 percent lower.
Houston Real Estate Highlights in July
- Single-family home sales were down 8.5 percent year-over-year, the 16th consecutive month of slowing sales volume, however there continued to be signs of overall improvement to the local housing market;
- The 8.5 percent decline is the smallest since the market registered a 7.6 percent drop in June 2022;
- Compared to July 2019, before the pandemic, sales were down 15.3 percent, and compared to July 2018, five years back, they were down 5.8 percent.
- Days on Market (DOM) for single-family homes rose from 27 to 42 days;
- Total property sales fell 8.3 percent with 9,223 units sold;
- Total dollar volume dropped 8.8 percent to $3.7 billion;
- The single-family median price dropped 2.3 percent to $340,000;
- The single-family average price edged up 0.6 percent to $428,140;
- Single-family home months of inventory registered a 3.2-months supply, up from 2.4 months a year earlier – the biggest supply in three years;
- Townhome/condominium sales experienced their 14h straight monthly decline, falling 9.8 percent, with the median price down 2.2 percent to $220,000 and the average price up 2.1 percent to $263,876;
- Compared to pre-pandemic 2019, townhome and condominium sales were down 14.6 percent.