

Easing prices and expanded inventory pave the way for a promising spring homebuying season
As the Houston housing market continues to transition to pre-pandemic conditions, positive indicators are beginning to blossom. While February sales were down year-over-year, they were up compared to the last pre-pandemic February, in 2019. In addition, year-over-year pricing fell for the first time in more than two years and more homes were listed for sale. These are among the signs that would-be homebuyers have anticipated after moving to the sidelines last year when mortgage interest rates began to rise.
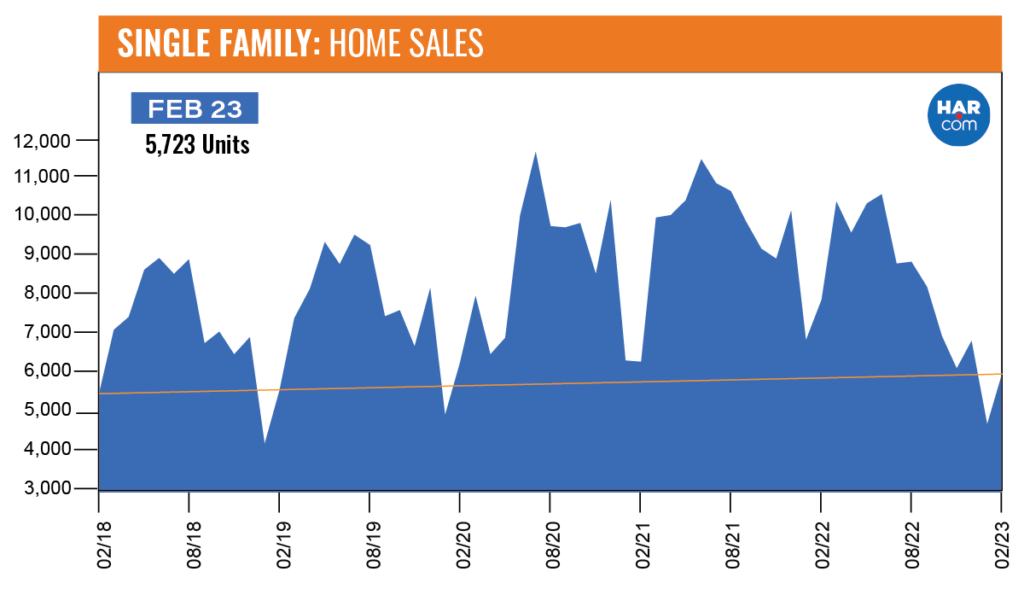
According to the Houston Association of Realtors’ (HAR) February 2023 Market Update, single-family home sales fell 23.0 percent, with 5,723 units sold compared to 7,430 in February 2022. That marks the 11th consecutive monthly decline. However, when compared to the last February before the pandemic – February of 2019, with sales volume of 5,339 units – sales were up 7.2 percent.
All housing segments saw year-over-year declines in February. By contrast, both single-family and townhome/condominium rentals had solid gains, with buyers pivoting to the rental market until mortgage rates ease and inflation subsides. HAR will issue its latest report on rental trends in the February 2023 Rental Home Update, to be released next Wednesday, March 15.
“For a true apples-to-apples comparison of the Houston housing market, you have to examine where we were before the pandemic, in 2019, and by that standard, we are in similar territory,” said HAR Chair Cathy Treviño with Side, Inc. “The traditional year-over-year comparison shows a market slowdown, but even then, there are positive trends in the form of moderating prices and growing inventory that bode well for spring homebuying.”
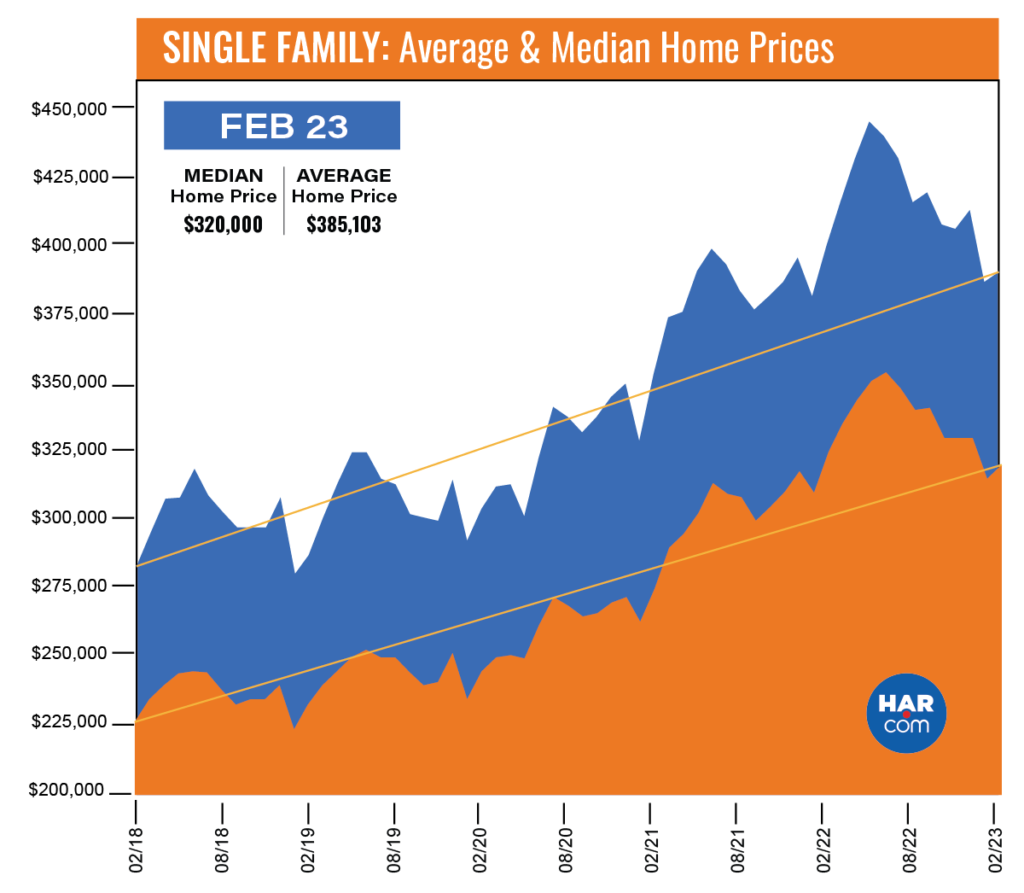
Single family home prices fell for the first time since the spring of 2020. The average price dropped 2.4 percent to $385,103 and the median price declined 1.6 percent to $320,000. That is in sharp contrast to when prices reached record highs of $438,294 (average) in May 2022 and $353,995 (median) in June 2022.
February Monthly Market Comparison
February marked the 11th straight month of negative sales as housing here and across the U.S. recovers from potent economic headwinds. Year-over-year single-family home sales fell 23.0 percent, but when compared to February 2019, before the pandemic, sales were up 7.2 percent, and compared to February 2018, five years ago, sales were up 8.7 percent.
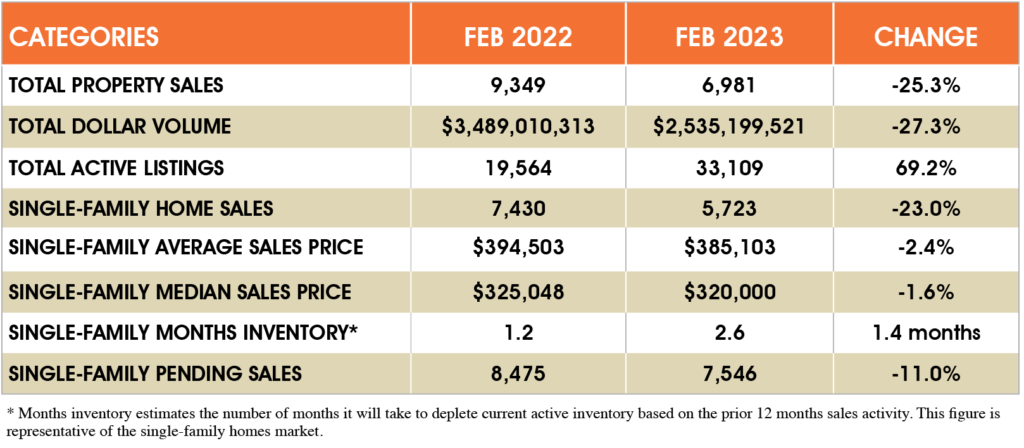
The monthly housing measurements for February consist of largely negative readings. In addition to the drop in single-family home sales, total property sales and total dollar volume fell; single-family pending sales dropped 11.0 percent. Active listings (the total number of available properties) remained 69.2 percent ahead of their level a year ago.
Months of inventory continued to improve, growing to a 2.6-months supply in February. Housing inventory nationally stands at a 2.9-months supply, according to the latest report from the National Association of Realtors (NAR). A 4.0- to 6.0-months supply is generally considered a “balanced market” in which neither the buyer nor the seller has an advantage.
February Single-Family Homes Update
Single-family home sales fell 23.0 percent year-over-year in February, with 5,723 units sold across the Greater Houston area compared to 7,430 in 2022. Pricing continues to moderate after reaching record highs last spring. February’s median price fell 1.6 percent to $320,000 while the average price dropped 2.4 percent to $385,103. Those are the first pricing declines since the spring of 2020.
For a pre-pandemic perspective, February sales are up 7.2 percent compared to February 2019, when a total of 5,339 single-family homes sold. The median price then was 37.3 percent lower at $233,000, and the average price, at $284,864, was 35.2 percent lower. Sales are 8.7 percent ahead of where they were five years ago, in February 2018, when volume totaled 5,265. Back then, the median price was $226,400 and the average price was $280,894 – reflecting pricing jumps of 41.3 percent and 37.1 percent, respectively.
Days on Market, or the actual time it took to sell a home, increased from 42 to 63 days. Months supply registered 2.6 months compared to 1.2 months a year earlier. The current national supply stands at 2.9 months, as reported by NAR.
Broken out by housing segment, February sales performed as follows:
- $1 – $99,999: decreased 2.2 percent
- $100,000 – $149,999: decreased 27.0 percent
- $150,000 – $249,999: decreased 17.2 percent
- $250,000 – $499,999: decreased 23.4 percent
- $500,000 – $999,999: decreased 23.3 percent
- $1M and above: decreased 33.3 percent
- HAR also breaks out sales figures for existing single-family homes. Existing home sales totaled 3,939 in February, down 31.0 percent from the same month last year. The average price fell 2.1 percent to $382,366 and the median sales price declined 3.9 percent to $306,415.
For HAR’s Monthly Activity Snapshot (MAS) of the February 2023 trends, please click HERE to access a downloadable PDF file.
Townhouse/Condominium Update
Townhouses and condominiums experienced their ninth consecutive monthly decline in February, down 32.4 percent year-over-year with 442 closed sales versus 654 a year earlier. The average price dropped 7.8 percent to $244,595 – the fourth straight monthly decline – and the median price fell 3.8 percent to $216,510. Both figures are below the historic highs reached in April 2022. Inventory grew from a 1.3-months supply to 2.1 months.
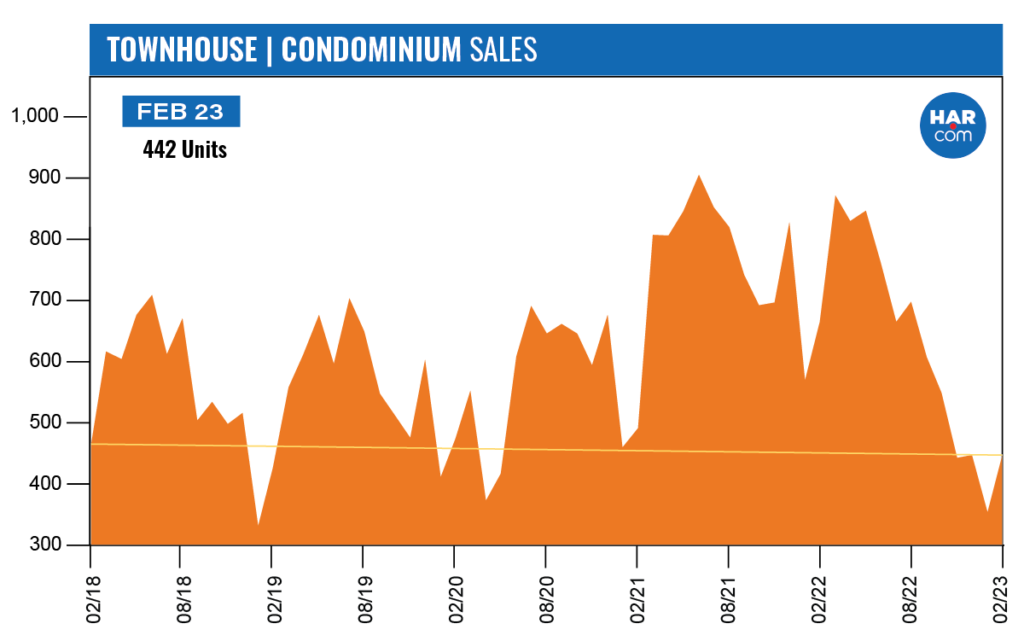
Compared to pre-pandemic February 2019, when 423 units sold, townhome and condominium sales rose 4.5 percent. The average price back then, at $188,810, was 29.5 percent lower and the median price, at $151,500 was 42.9 percent lower.
Houston Real Estate Highlights in February
- Single-family home sales fell 23.0 percent year-over-year, as the market continues its recovery from economic headwinds;
- Compared to pre-pandemic 2019, single-family home sales were up 7.2 percent;
- All housing segments experienced negative sales;
- Days on Market (DOM) for single-family homes rose from 42 to 63 days;
- Total property sales fell 25.3 percent with 6,981 units sold;
- Total dollar volume dropped 27.3 percent to $2.5 billion;
- The single-family average price fell 2.4 percent to $385,103;
- The single-family median price dropped 1.6 percent to $320,000;
- Both pricing decreases were the first since the spring of 2020;
- Single-family home months of inventory registered a 2.6-months supply, up from 1.2 months a year earlier;
- Townhome/condominium sales experienced their ninth straight monthly decline, falling 32.4 percent, with the average price down 7.8 percent to $244,595 and the median price down 3.8 percent to $216,510;
- Compared to pre-pandemic 2019, townhome and condominium sales were up 4.5 percent.

